TheJakartaPost
Please Update your browser
Your browser is out of date, and may not be compatible with our website. A list of the most popular web browsers can be found below.
Just click on the icons to get to the download page.

Spending slowdown: Mystery and elucidation
In analyzing the low purchasing power, there are two factors that must be considered: household spending expenditure patterns and expenditure contribution of each income segment.
Change Size
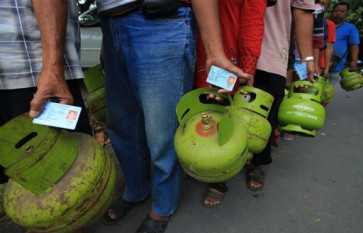
 Residents queue to buy 3-kilogram liquefied petroleum gas (LPG) canisters during a market operation in Surakarta, Central Java. (Antara/File)
S
igns of weakening consumer spending have appeared since last year. During Idul Fitri in 2016, the inflation rate had decreased from the previous year.
Inflation during Idul Fitri this year was 3.8 percent. Comparing this year’s rate with that during Idul Fitri in 2016 when inflation stood at 3.2 percent, the rates are not that different. Some economists say low inflation indicates weakening purchasing power.
International institutions have revised their forecast on Indonesia’s economic growth in 2017. While the Asian Development Bank (ADB) maintained its growth projection at 5.1 percent, the International Monetary Fund (IMF) increased its projection to 5.2 percent. The revision is attributed to decreased consumer spending in the last few months.
According to the ADB’s revised outlook, in the past six months, household spending was the biggest contributor to economic growth at 4.9 percent. This figure has decreased from 2016.
In analyzing the low purchasing power, there are two factors that must be considered: household spending expenditure patterns and expenditure contribution of each income segment. In this case, microdata analysis will provide a clearer picture of the changes
The first factor is household expenditure patterns. In general, the per capita expenditure pattern is inverted between cities and villages. According to the Central Statistics Agency (BPS), in 2016, in the cities, non-food expenditures accounted for 55.8 percent of expenditures per capita.
Looking at the composition, non-food expenditures mostly went to housing and household facilities, reaching 26 percent and remaining the same from 2015 until 2016.