TheJakartaPost
Please Update your browser
Your browser is out of date, and may not be compatible with our website. A list of the most popular web browsers can be found below.
Just click on the icons to get to the download page.

Popular Reads
Top Results
No results found. Please check your search term and try again
Can't find what you're looking for?
View all search resultsPopular Reads
Top Results
No results found. Please check your search term and try again
Can't find what you're looking for?
View all search resultsJakarta 'happy' despite clog
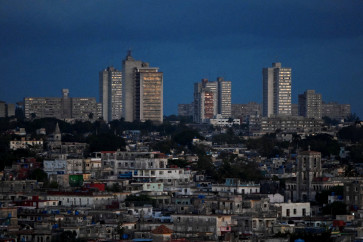
10 factors influencing THE HAPPINESS INDEXDespite being ranked as the city with the worst traffic in the world and landing at the bottom of a global index for city safety, Jakarta is apparently home to happy residents
Change text size
Gift Premium Articles
to Anyone
Share the best of The Jakarta Post with friends, family, or colleagues. As a subscriber, you can gift 3 to 5 articles each month that anyone can read—no subscription needed!

10 factors influencing THE HAPPINESS INDEX
Despite being ranked as the city with the worst traffic in the world and landing at the bottom of a global index for city safety, Jakarta is apparently home to happy residents. Or at the very least Jakartans are happier than the average Indonesian.
Jakarta scored 69.21 on the 2014 Happiness Index released by the Central Statistics Agency (BPS) on Thursday. That is 0.93 higher than the national average of 68.28.
Last week, the Economist Intelligence Unit place Jakarta last in its Safe Cities Index, while a few days ago British lubricant producer Castrol said Jakarta had the worst traffic in the world.
BPS Jakarta head Nyoto Widodo said that although Jakarta was not among the 10 happiest provinces in Indonesia, the capital was the second happiest city in Java.
'We are number two after Yogyakarta, which scored 70.77,' he said.
The three happiest provinces are Riau Islands with a score of 72.42, Maluku (72.12) and East Kalimantan (71.45), while the least happy provinces were Papua (60.57), East Nusa Tenggara (66.22) and West Sumatra (66.79). Jakarta was the 14th happiest among Indonesia's 34 provinces.
The BPS used 10 factors to measure happiness: family income, housing and asset ownership, employment, education, health, amount of leisure time, social relations, family relations, safety and environmental conditions. Scores could range from 0 to 100, with 100 being the happiest.
The BPS surveyed 70,631 households in all 34 provinces; 57.84 percent were in urban areas and the rest were in rural areas.
The index showed that Indonesians were happier in 2014 than in 2013, when the nation scored 65.11. Last year, the BPS only released a national index, but this year each province released its own index.
The 2014 Happiness Index showed that women (68.61) were happier than men (67.94), and single people (68.77) were slightly happier than married people (68.74). Divorcees were the least happy (65.04).
In contrast, singles in Jakarta were the least happy when compared with married people (69.32), divorcees (67.90) and widowers (69.29).
'Single people in Jakarta are the least happy people with a score of only 66.96, while the national survey shows that single people are the happiest,' BPS Jakarta social statistics unit head Sri Santo Budi M. said.
She added that Jakartans felt happiest when the family consisted of two members and their happiness index decreased when they were in a family of three.
Nationwide, the happiest households are those with four family members (68.97). But when the number of family members exceeded five, the score decreased.
The index showed that across Indonesia, the 25-40 age group was the happiest, while the least happy age group was 65-plus.
Contrary to national trends, 'in Jakarta, people older than 65 had the highest happiness score (70.39), while the lowest score belonged to the 17-24 age group,' she said.
The index showed that education and income played a significant role in happiness. The higher the education and income, the happier the respondents were.
Those who did not finish formal education scored 65.30, those with elementary school education 67.03. The scores steadily increased to 79.47 for respondents with graduate/post-graduate degrees.
The same trend applief to income, in which those with household income less than Rp 1.8 million (US$142) were the least happy (64.58) and those with more than Rp 7.2 million the happiest (76.34).
Of the 10 factors measured, respondents showed the least satisfaction with their educational level, followed by their family income and employment. Respondents were happiest when they had family relations (78.89), which was followed by good environmental conditions (74.86).
In 2014, Indonesia scored higher in all 10 factors compared to 2013. Satisfaction regarding family income (63.09) showed the biggest improvement over the year, with 5.06 more points compared to the 2013 index score of 58.03.
The BPS' Happiness Index aims to complement finance-based indicators in gauging prosperity. The Happiness Index is a subjective indicator that is known as a measurement that goes 'beyond GDP [Gross Domestic Product]', BPS said upon its release.