TheJakartaPost
Please Update your browser
Your browser is out of date, and may not be compatible with our website. A list of the most popular web browsers can be found below.
Just click on the icons to get to the download page.

Popular Reads
Top Results
No results found. Please check your search term and try again
Can't find what you're looking for?
View all search resultsPopular Reads
Top Results
No results found. Please check your search term and try again
Can't find what you're looking for?
View all search resultsExplaining heavy rains, floods in Indonesia
Aside from the commonly known La Niña, another weather phenomenon to keep an eye on to explain variations in the tropical climate of Indonesia is the Madden-Julian oscillation.
Change text size
Gift Premium Articles
to Anyone
Share the best of The Jakarta Post with friends, family, or colleagues. As a subscriber, you can gift 3 to 5 articles each month that anyone can read—no subscription needed!
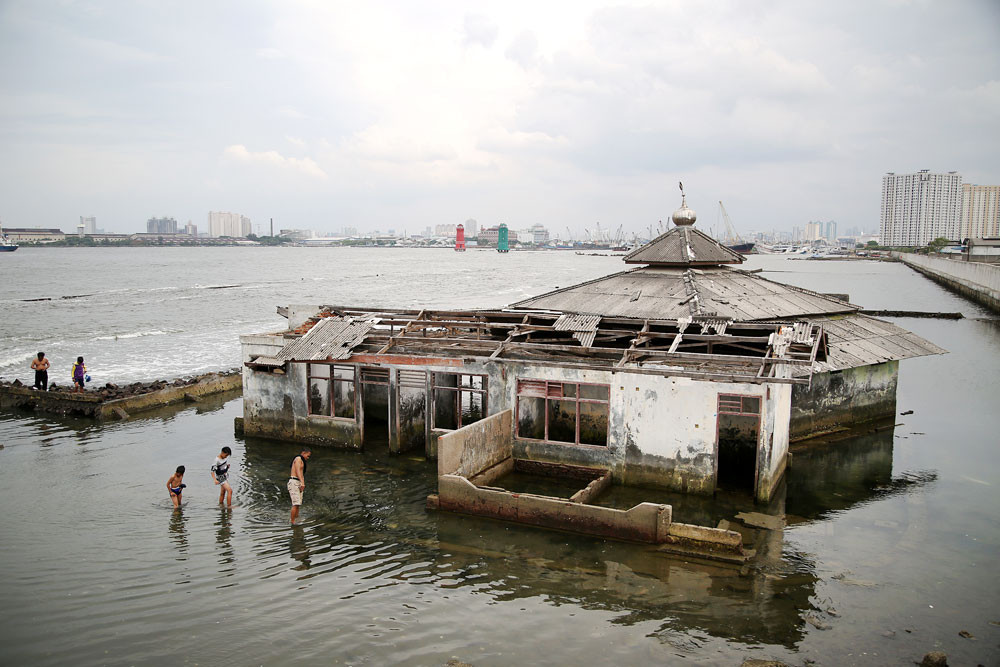 Children of Muara Baru, Penjaringan, North Jakarta, look for clams near an abandoned Muslim prayer house inundated by seawater. The old embankment could not contain tidal floods in the area, inundating the prayer house located near the shore. (The Jakarta Post/P.J. Leo)
H
eavy rains in March have resulted in floods across the country. The Kompas newspaper in its March 8 edition reported that, according to the National Authority for Disaster Management (BNPB), there were 15 affected districts in East Java alone, with Madiun being the worst-hit.
BNPB spokesperson Sutopo Purwo Nugroho and National Agency for Meteorology, Climatology and Geophysics (BMKG) head of meteorology Mulyono R. Prabowo explained that the high intensity of rainfall was due to the Madden-Julian oscillation (MJO).
What, in fact, is the MJO, what distinguishes it from La-Niña and how can we get an early warning?
Indonesia lies within the intertropical convergence zone and borders on two vast oceans on its western and eastern sides, the Indian and the Pacific Ocean. This position results in a typical maritime climate. Surplus short-wave solar radiation in the equatorial ocean region may result in strong evaporation throughout the year. Humidity as a result of water vapor condensation is also higher, which is why the region tends to be cloudy at most times, leading to high rainfall variability. On the other hand, convective clouds driven by different diurnal heating over land and over sea may produce severe thunderstorms and even the formation of squall lines in many areas of Indonesia.
Meanwhile, as a result of the changing climate, the sea surface temperature is rising. Warmer sea temperature in the equatorial ocean region may intensify bands of convective clouds, which then create heavy rainfall, hail and surface wind gusts as well as twisters in the Indonesian region. Besides, the increase of sea surface temperature strongly influences climate variability in the region, i.e. the occurrence of El-Niño or La- Niña in the Pacific as well as Dipole Mode in the Indian Ocean, where such anomalies are projected to become more frequent in the future. Those climate phenomenons can be recognized by distinctive clouds pattern.
El-Niño and La-Niña are associated with the cooling and warming of sea surface temperature. Both are monitored based on sea surface temperature changes in the Pacific.
As the temperature drops, the rate of evaporation falls too, causing humidity to decrease. Consequently, convective clouds diminish, the sky is blue, the rain is gone and a longer dry season follows as a result of the delay of the onset. This results in what we know as El-Niño.
On the contrary, with La-Niña, strong condensation occurs as sea surface temperature increases. Following the abundance of humidity, large amounts of latent heat released contribute to the development of strong convective clouds. Torrential rain then falls in most parts of Indonesia, floods and landslide ensue.
In the meantime, a sister climate anomaly of El-Niño and La-Niña emerges in the Indian Ocean, namely Dipole Mode. If sea surface temperature anomalies in the western tropical Indian Ocean are higher, a so-called positive Dipole Mode, it will cause rainfall to decrease to below the normal level in Indonesia, leading to severe drought. In contrast, a negative Dipole Mode will see Indonesia suffer from intense rainfall above normal. El-Niño and La-Niña as well as Dipole Mode are categorized as nonseasonal climate factors. They have a return period of two to five years. Yet, such interannual events, particularly El-Niño and La-Niña, are well-known factors in the rainfall variability in Indonesia. For instance, El-Niño in 1997-1998 and 2015 and La-Niña in 2007 and 2016 were responsible for drought and floods in Indonesia.
Another factor that involves variations of climate over tropical regions is the Madden-Julian oscillation. It is considered as west-east circulation, originating from the Indian Ocean and vanishing in the western Pacific. The MJO is a convergent system that has an oscillation period of 30-60 days. It is identified as massive cumulonimbus clouds that occur during the transition period from March to May. Strong solar radiation quickly heats up the ocean, causing higher temperature at the surface. As stated above, this fuels on the growth of deep convective clouds, and pressure gradient causes the towering clouds accompanied by intense rainfall to move eastward across Indonesia. Above normal rainfall is recorded as it the resulting weather passes. If the environmental conditions are bad, it subsequently causes floods. The situation becomes worse when the MJO and La-Niña signals appear simultaneously.
The MJO is monitored with the MJO index, which is accessible online through the Australian Bureau of Meteorology. In March 2019, an MJO signal was detected to propagate above Indonesia and its surrounding area. High strength is indicated when the signal is outside of the centered circle. A strong signal has been observed to appear as intense rainfall occurs over Java. The whole Indonesian region is prone to the MJO, but due to southern cyclonic rotation, humid air is particularly attracted to the region of Java.
Rather than La Niña, the MJO may turn into a major climate threat, since it occurs intraseasonally. The MJO could occur more frequently amid climate change. As weather is a natural phenomenon, impact-based warning could be based on predicted monitoring. It could be both climate and floods forecasting.
The simplest way to do that is by measuring the rainfall accumulation. Floods are detected as rainfall exceeds its average climatological condition (at least 30 years of observation). The BMKG classifies climate conditions by degree, such as below normal, normal and above normal. A climate condition is considered normal if it ranges between 85 percent and 115 percent of the average. It is considered below and above normal if it is lower or higher than 85 percent or 115 percent of the average, respectively.
With the support of the data, we can easily perform a simple calculation to predict the climate outlook in the future. In addition, many free-to-access extreme climate indices have been developed by the World Meteorological Organization. These could be tools to assess flood risks.
Weather modification through cloud seeding definitely requires large expenses, while the probability of success is small. Building public awareness of environmental care is essential. The protection of watershed areas, the preservation of forest and catchment areas, a green policy, the management of drainage system as well as the reduction of polymer waste are necessary.
In addition, disasters in Indonesia can become worse as a result of mismanagement; a classic problem in the country.
Above all, tropical regions, including Indonesia, without doubt can be regarded as giant weather engines. Not only do they produce rainfall clouds that brings life and hope to the region, they also control the Earth's climate system, bringing life to the globe. We can be grateful for this. (wng)
***
The writer is a Ph.D student in applied climatology at the Graduate School of the Bogor Institute of Agriculture (IPB University).