TheJakartaPost
Please Update your browser
Your browser is out of date, and may not be compatible with our website. A list of the most popular web browsers can be found below.
Just click on the icons to get to the download page.

Popular Reads
Top Results
No results found. Please check your search term and try again
Can't find what you're looking for?
View all search resultsPopular Reads
Top Results
No results found. Please check your search term and try again
Can't find what you're looking for?
View all search resultsCan inflation be better measured with big data?
The relevant statistics agency needs to firstly determine the basket of goods being calculated to best mimic the overall cost of living standard.
Change text size
Gift Premium Articles
to Anyone
Share the best of The Jakarta Post with friends, family, or colleagues. As a subscriber, you can gift 3 to 5 articles each month that anyone can read—no subscription needed!
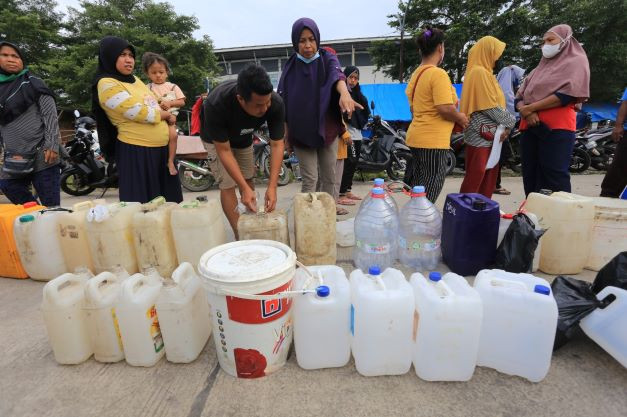 Oily business: Basic commodity sellers line up to purchase cooking oil during a market operation at Karangampel traditional market in Indramayu regency, West Java, on Feb. 23. (Antara/Dedhez Anggara)
I
nflation is one of the most important anchor indicators, particularly in emerging economies where consumption is predominantly spending on food. Consequently, increasing prices might directly oppress those in the lower-income bracket forcing them to tighten their belts and crimp spending on other household spending resulting in slower economic growth.
A recent press release by Statistics Indonesia (BPS) seemed to reflect a steady inflation rate in Indonesia. We experienced a low inflation rate of 0.66 percent in March 2022 (month-to-month), after deflation of 0.02 percent a month earlier. The core inflation, measured without taking food and energy costs into account, was even lower at 0.30 percent in March 2022 or almost constant, compared with 0.31 percent in February 2022.
The reality check might be somewhat different. Thanks to price apps such as Indomaret and Segari, we can observe approximate increases in prices in some commodities during February-March, for instance sugar (up by about Rp 1,500 [10 US cents]/kilogram), bread (Rp 1,000/pack), flour (Rp 1,000/kg), eggs (Rp 3,000 for 10 eggs), and chicken (Rp 3,000/kg). These were additional to the infamous increases in cooking oil and cooking gas prices. Blue gas has increased three times in just two months from Rp 160,000 to Rp 180,000 and eventually reached Rp 200,000 per 12 kg, whereas the Bimoli cooking oil price rose from Rp 27,000 to Rp 47,000 for 2 liters.
Is there any bottleneck in the calculation? Why do the official statistics report more stable prices than what we might observe in the market?
To recall, the inflation rate is measured based on the change in the consumer price index (CPI) over time. It indicates the overall cost of goods and services purchased by society to portray the changes in the cost of living.
Gregory Mankiw in Principles of Economics lays out five steps to calculate inflation. The relevant statistics agency needs to firstly determine the basket of goods being calculated to best mimic the overall cost of living standard. The basket might be different across regions.

For example, some regions might be weighted-up with a greater volume of rice whereas others with flour. Once the basket has been decided, the basket cost is calculated by multiplying the price and quantity to obtain the total spending on consumer items. The agency then decides the base year to calculate the inflation rate as the percentage change in the CPI over the years using the same determined base year.