TheJakartaPost
Please Update your browser
Your browser is out of date, and may not be compatible with our website. A list of the most popular web browsers can be found below.
Just click on the icons to get to the download page.

Popular Reads
Top Results
No results found. Please check your search term and try again
Can't find what you're looking for?
View all search resultsPopular Reads
Top Results
No results found. Please check your search term and try again
Can't find what you're looking for?
View all search resultsDiverging fortunes: Garuda Indonesia vs. Singapore Airlines
While the global aviation industry is indeed recovering from the pandemic, the contrast between two national carriers in Southeast Asia is striking.
Change text size
Gift Premium Articles
to Anyone
Share the best of The Jakarta Post with friends, family, or colleagues. As a subscriber, you can gift 3 to 5 articles each month that anyone can read—no subscription needed!
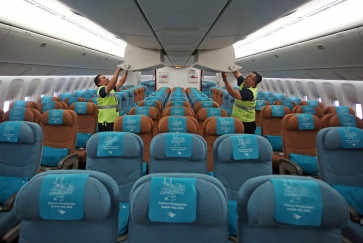
 Maintenance workers clean a Garuda Indonesia aircraft on May 8, 2024, at a hangar at Soekarno-Hatta International Airport in Tangerang, Banten. (Antara/Muhammad Iqbal)
S
ingapore Airlines recently reported a record-breaking profit of S$2.8 billion (US$2.1 billion) for the fiscal year ending March 31, 2025. As a gesture of appreciation, the airline awarded its employees a bonus equivalent to nearly eight months of salary.
This news is both impressive and thought-provoking. While the global aviation industry is indeed recovering from the pandemic, the contrast between two national carriers in Southeast Asia, Singapore Airlines and Garuda Indonesia, is striking.
Singapore Airlines has posted its highest net profit in history, while Garuda Indonesia continues to face financial pressure, despite completing a major debt restructuring. Why do two airlines operating in the same region have such vastly different outcomes?
According to its latest financial report, Singapore Airlines recorded S$20.2 billion in total revenues and net profit of S$2.8 billion as of the end of March 2025. Its load factor, an indicator of seat occupancy, reached 89 percent, reflecting high operational efficiency.
In contrast, Garuda Indonesia posted annual total revenue of $3.42 billion as of Dec. 31, 2024, with a net loss of approximately $69.78 million. This marked a significant decline from 2023, when Garuda Indonesia booked extraordinary gains from bond retirements and subsidiary restructuring, transactions that did not recur in 2024. Its load factor remained around 74 percent, although umrah (minor haj) and haj flights contributed positively in early 2025.
This gap reflects not only differences in scale but also the effectiveness of each airline’s financial and operational strategies.

Key financial ratios further highlight the disparity. Garuda Indonesia’s debt-to-equity ratio (DER) stands at approximately 2.8, indicating a heavy reliance on debt. A high DER suggests greater financial risk and dependence on borrowed capital. Garuda Indonesia’s current ratio remains below 1.0, signaling potential short-term liquidity issues. This ratio measures a company’s ability to meet short-term obligations using its current assets.


Your Opinion Matters
Share your experiences, suggestions, and any issues you've encountered on The Jakarta Post. We're here to listen.
Enter at least 30 characters
0
/ 30
Thank you
Thank you for sharing your thoughts. We appreciate your feedback.