TheJakartaPost
Please Update your browser
Your browser is out of date, and may not be compatible with our website. A list of the most popular web browsers can be found below.
Just click on the icons to get to the download page.

Popular Reads
Top Results
No results found. Please check your search term and try again
Can't find what you're looking for?
View all search resultsPopular Reads
Top Results
No results found. Please check your search term and try again
Can't find what you're looking for?
View all search resultsGlobal energy and emissions trends since Paris treaty
In the decade since the landmark COP21 Paris Agreement, both a lot and a little has changed when it comes to the energy sector makeup and the trajectory of emissions.
Change text size
Gift Premium Articles
to Anyone
Share the best of The Jakarta Post with friends, family, or colleagues. As a subscriber, you can gift 3 to 5 articles each month that anyone can read—no subscription needed!
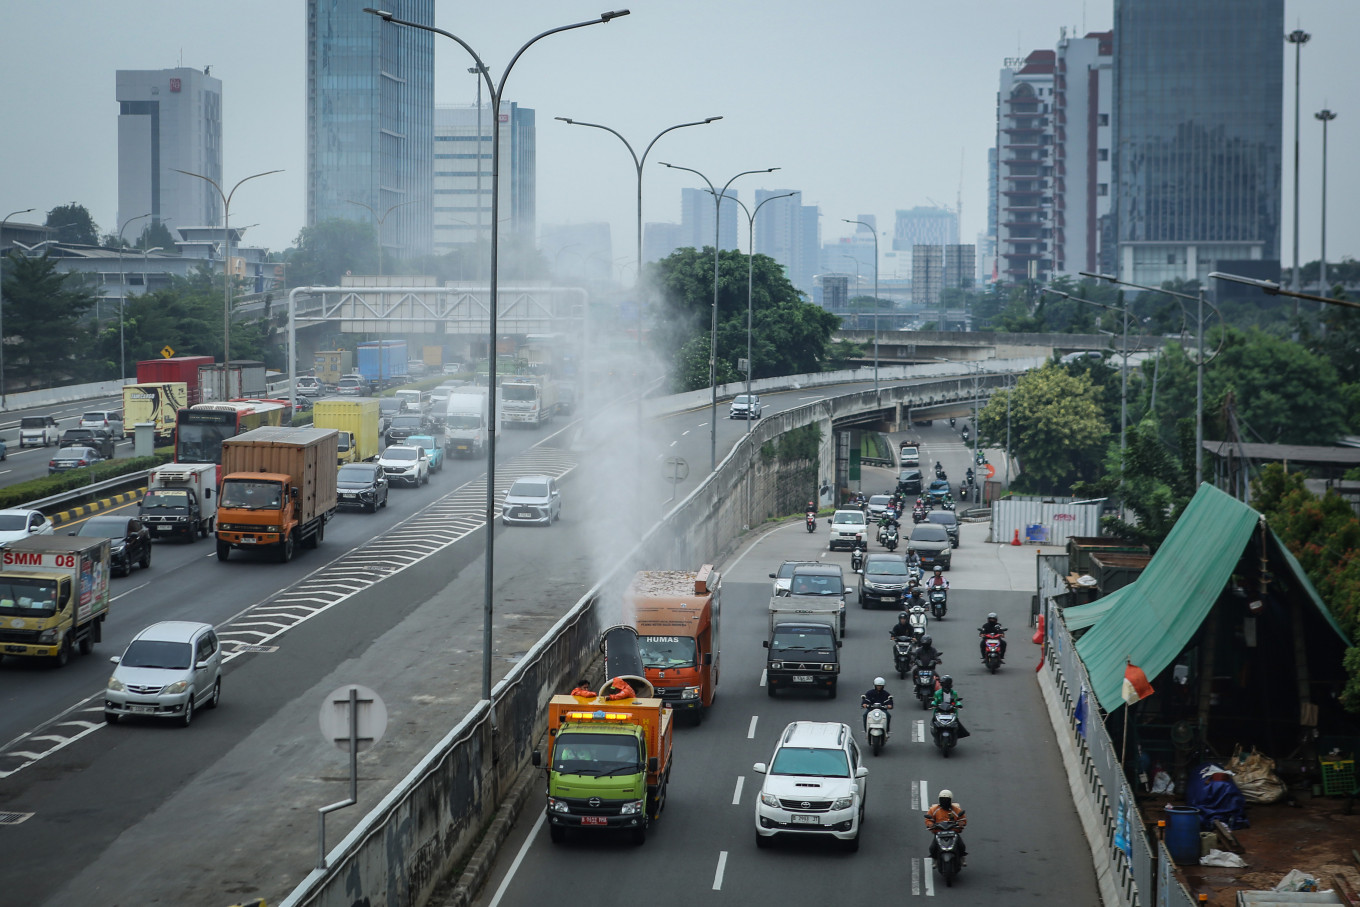 Jakarta Environmental Agency workers spray mist on Sept. 19, along Jl. TB Simatupang in South Jakarta. The agency sprayed 4,000 liters of mist at several strategic points to reduce air pollution in an attempt to clean the cities air ahead of Jakarta Eco Future Fest (JEFF) 2025. (Antara/Asprilla Dwi Adha)
I
n the decade since the landmark COP21 Paris Agreement that aimed to limit global warming, both a lot and a little has changed when it comes to the energy sector makeup and the trajectory of emissions.
On the one hand, an explosion in renewable energy deployment and a surge in electric vehicle sales have upended global power and car markets and ushered in an ongoing "electrify everything" push across the planet.
On the other hand, global output and use of coal, crude oil and natural gas have continued to climb to record levels, along with resulting energy use emissions, which in 2024 were nearly 10 percent more than discharged in 2015.
The following are 10 key numbers spanning the global energy mix and power pollution trends to help take stock of where things stand as the COP30 climate meetings get underway in Brazil.
Total global energy supplies remain overwhelmingly fossil fuel-dependent, even after the fastest-ever rollout of clean energy supplies within a 10-year period.
Fossil fuels continue to account for around 87 percent of global energy supplies, thanks to historically high use of crude oil, coal and natural gas, data from the Energy Institute shows.

The good news for clean energy advocates is that the fossil fuel share is down from 89 percent in 2015, and will keep falling.
The bad news for climate trackers is that the momentum of global fossil fuel use remains on the upside, despite the curbing of coal-burning in many economies and the accelerating shift towards electrifying transport and industrial processes.
Clean energy supporters have more to cheer about when it comes to electricity production, where record growth in solar panels, wind farms and battery systems are lifting the share of clean power in generation mixes to record highs.
Global clean electricity supplies jumped by 22 percent from 2015 to 2024, data from Ember shows, while generation from fossil fuel sources has dropped by 11 percent.
The utility systems of Europe and Latin America both generate over 60 percent of electricity from clean power sources, while the global average is around 40 percent and rising.
The global surge in renewable power generation has been the key story of the world energy systems so far this decade, and for good reason.
Between 2015 and 2024 there was a 68 percent surge in the consumption of electricity from renewable sources across all energy systems, which includes electricity networks and industrial power systems.
A nearly 700 percent surge in solar power output and a 200 percent jump in wind power supplies since 2015 have been the chief drivers of that renewables swell.
Regionally, Asia has dominated the rollout of both solar and wind technologies over the past decade, and in 2024 accounted for 45 percent of all renewable energy generation.
Europe is the second-largest renewables implementer, with a roughly 20 percent share, followed by North America, with an 18 percent share.
In terms of solar generation, Asia's share is closer to 60 percent of the global footprint, while Europe and North America are again the next-largest solar markets.
Asia also tops the world in wind power deployment.
The rapid global ramp-up in renewables generation, alongside the longer-term reduction in coal-fired power production in several countries, has led to declines in energy emissions in North America and Europe since 2015.
Elsewhere, however, energy emissions trajectories remain on a rising path, especially in Asia, which accounted for 52 percent of all energy emissions last year, according to the Energy Institute.
At the country level, the United States has reduced its energy emissions by more than any other nation since 2015, followed by Japan and Germany.
However, even as the US, Japan, Germany and other major economies have taken steps to reduce their pollution from energy systems, their collective emissions cuts have been more than offset by the rising pollution trends elsewhere.
Indeed, China alone has boosted its energy pollution by more than the collective emissions cuts by the 20-largest economies to reduce emissions since 2015, Energy Institute data shows.
And when you add in the growing pollution tolls from the likes of India, Indonesia and Vietnam, it is clear the momentum of global energy pollution remains firmly on the upside for now.
The rapidly growing network of battery energy storage systems (BESS) could help slow the growth of energy emissions going forward, especially in nations with large footprints of solar production.
As with renewables generation, Asia dominates the deployment of utility-scale battery systems, thanks mainly to China's world-leading position as the top battery producer.
But the US and Australia also boast hefty BESS capacity, which should help utilities make fuller use of their abundant solar assets by charging batteries during peak solar output periods and then dispatching that when demand rises.
In many areas, BESS deployment represents the next wave of the ongoing energy transition, and should help many major power systems make good on more of the commitments made at the Paris COP gathering a decade ago.
---
The writer is a columnist for Reuters. The opinions expressed are personal.