The Jakarta Post
Please Update your browser
Your browser is out of date, and may not be compatible with our website. A list of the most popular web browsers can be found below.
Just click on the icons to get to the download page.


Popular Reads
Top Results
No results found. Please check your search term and try again
Can't find what you're looking for?
View all search results
Popular Reads
Top Results
No results found. Please check your search term and try again
Can't find what you're looking for?
View all search results‘Desil-desilan’: Indonesia’s welfare ranking needs more than a data refresh
The deeper issue is that a probabilistic statistical estimate is being wielded as an indisputable administrative fact; one deemed sharp enough to decide who gets subsidized fuel and who walks away empty-handed.
Change text size
Gift Premium Articles
to Anyone
Share the best of The Jakarta Post with friends, family, or colleagues. As a subscriber, you can gift 3 to 5 articles each month that anyone can read—no subscription needed!
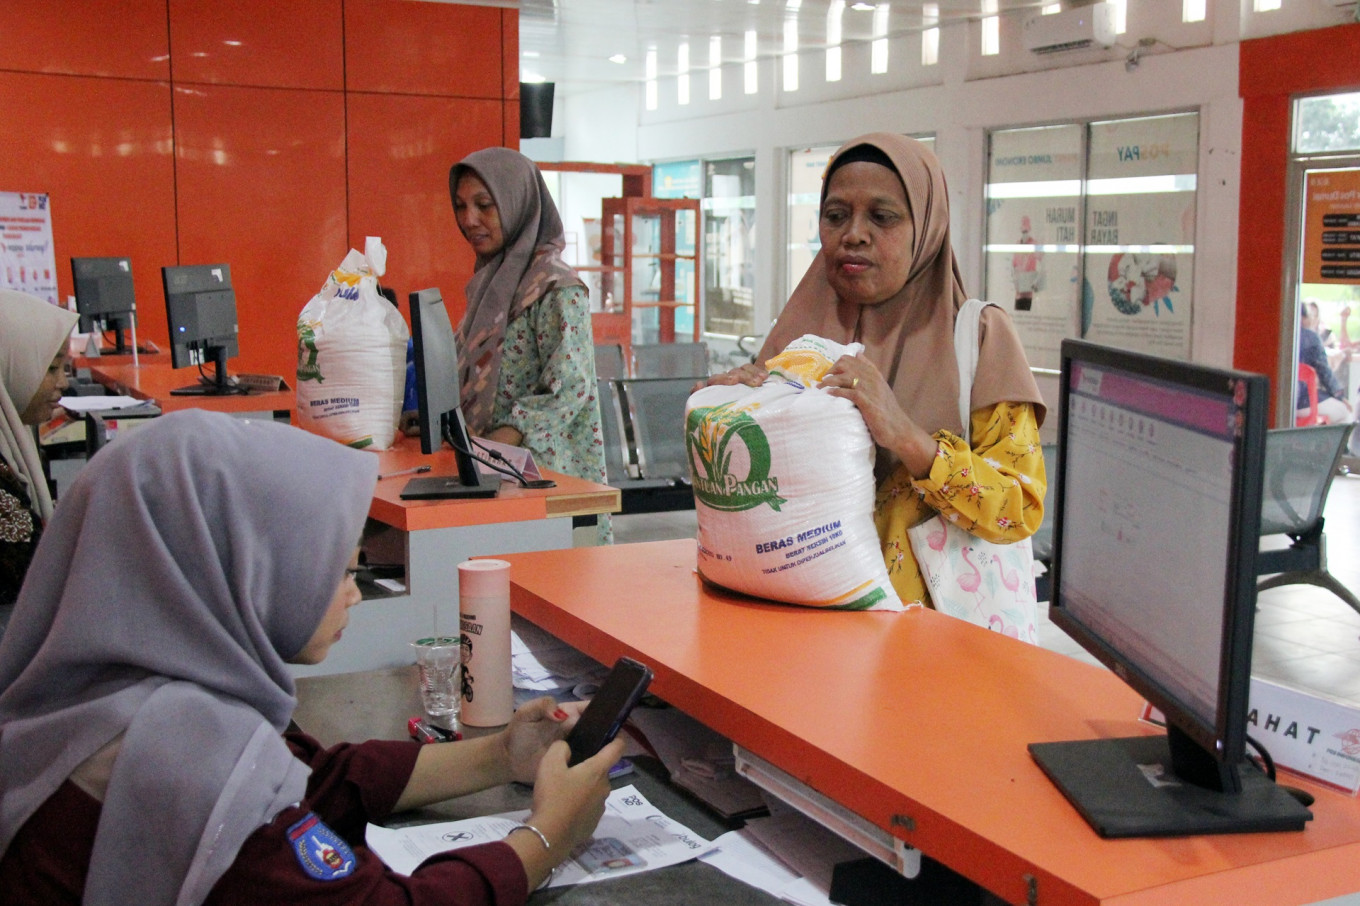 Social aid recipient receive a sack of rice from the government's food reserves distribution program on Oct. 29, 2024, at the Dumai Post Office in Riau. (Antara/Aswaddy Hamid )
I
magine being officially classified among the top 20 percent of households in Indonesia while making a living pedaling a becak (pedicab) or pushing a meatball cart under the scorching sun.
This is no hypothetical. Over the past few weeks, it has become a genuine grievance voiced by ordinary citizens who discovered they had been assigned to decile 9 or 10 - the wealthiest tiers - under the government's National Socioeconomic Data (DTSEN). Public backlash spread quickly enough that ministers and the head of Statistics Indonesia (BPS) all stepped forward to issue public statements within days.
The deeper issue is not just that the underlying registry has aged. It is that a probabilistic statistical estimate is being wielded as an indisputable administrative fact - one deemed sharp enough to decide who gets subsidized fuel and who walks away empty-handed. When the serious public system turns into a guessing game, people call it desil-desilan (playing or gambling with deciles). The term captures what happens when an educated guess is mistaken for settled truth.
The underlying mechanics are worth unpacking. DTSEN is not a single survey; it is an umbrella database consolidating the older Social Welfare Data (DTKS), extreme poverty records (P3KE), and the 2022 Socioeconomic Registration (Regsosek), supplemented by administrative agency files.
The decile ranking is calculated on top of this pool. According to BPS, welfare rankings rely on a Proxy Means Test (PMT). Statisticians take a smaller, directly surveyed sample of households to measure actual consumption alongside observable living conditions: wall and roofing materials, water source, cooking fuel, asset ownership, power usage, family size, education and occupation.
A statistical model links these observable markers to estimated welfare, which is then mapped across every household in DTSEN. Households are ordered by their predicted scores and divided into ten equal groups, from decile 1 (the poorest 10 percent) to decile 10 (the wealthiest).

The operative word is estimated. Studies by the ILO and Development Pathways reviewing PMT implementations across developing nations reveal typical $R^2$ values between 40 percent and 60 percent. In practical terms, roughly half of all variation in actual household consumption remains unexplained. This is not a uniquely Indonesian failure, it is the structural ceiling of the proxy means method worldwide. Refreshing the underlying registry more often will not make that blind spot disappears.